
Detecting Asset Price Bubbles
27 February, 2025
Asset price bubbles have fascinated and troubled economists and investors for centuries. The allure of rapid price increases, followed by devastating crashes, has shaped financial history time and again—from the Dutch Tulip Mania of the 1600s to the dot-com boom and the 2008 financial crisis.While the causes of these bubbles may vary, their impact on markets, people's lives, and economies is undeniable. Detecting bubbles, however, is notoriously difficult. Distinguishing genuine growth from speculative excess requires more than just observing price surges—it demands a deep understanding of market behavior, investor psychology, and rigorous quantitative methods. In this article, we explore the intricate challenge of identifying asset price bubbles, combining theoretical foundations with quantitative techniques such as strict local martingales and neural networks. These approaches help shed light on the subtle signals that can indicate when an asset price is detaching from its fundamental value, a warning sign that has far-reaching implications for financial stability.
What is an Asset Price Bubble?
At its core, an asset price bubble represents an unsustainable surge in prices, driven not by intrinsic value but by speculative optimism—the belief that prices will continue to rise simply because they have been rising. This behavior fuels an artificial cycle of demand, with more investors rushing in, further inflating the bubble. Eventually, reality sets in, confidence falters, and the bubble bursts—often with severe economic consequences.
Bubbles are not confined to any single asset class. We have seen them in equities, real estate, commodities, and even digital assets like Bitcoin, each time leaving a trail of financial turbulence in their wake. However, detecting bubbles in real time is immensely challenging. Prices can deviate from fundamental values due to factors like market sentiment, technological shifts, or macroeconomic changes—not just speculative behavior. This ambiguity makes it difficult to determine when a rising market is experiencing genuine value appreciation versus when it is entering bubble territory. As a result, scholars and practitioners have spent decades developing models to quantify and identify these deviations, each offering different perspectives on how and when bubbles form.
Theoretical Foundations of Bubble Detection
One of the earliest debates in financial theory revolves around whether bubbles even exist in a rational market. The Efficient Market Hypothesis (EMH), introduced by Eugene F. Fama, argues that markets always reflect all available information, meaning that asset prices naturally adjust to their fundamental value over time. In this view, price fluctuations are random and unpredictable, making the notion of a "bubble" irrelevant. However, real-world crises—such as the housing market collapse in 2008—suggest that speculative excess and psychological biases do play a role in financial markets.
The divide in academic thought is clear: while some, like Fama (2014), dismiss the concept of bubbles as inconsistent with rational market behavior, others, such as O’Hara (2008), highlight the very real, devastating consequences bubbles can have on economies. Regardless of the theoretical stance, history provides ample evidence that when prices detach from fundamentals and speculative euphoria takes over, financial stability is at risk. The consequences extend beyond market losses—bubbles can misallocate resources, distort investment decisions, and lead to economic recessions. This underscores the urgent need for effective detection methods that go beyond theory, incorporating empirical techniques that capture both rational and irrational elements of market behavior.
Lifetime Stages of a Financial Bubble
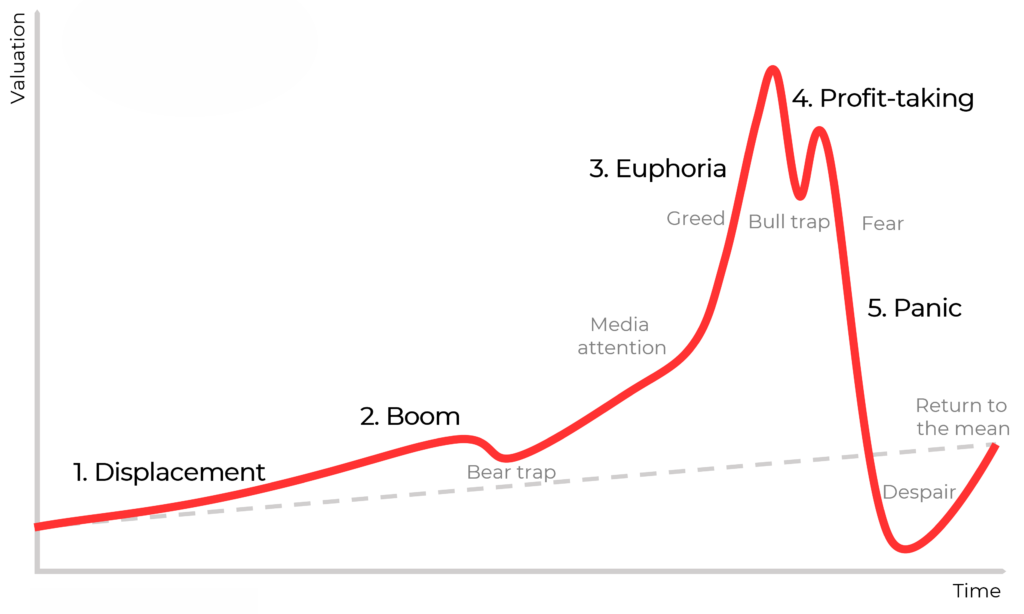
While each financial bubble is unique, they tend to follow a predictable pattern, moving through a series of well-defined stages:
- Displacement: A new economic paradigm, innovation, or asset class attracts attention, leading to increased investor interest.
- Boom: Prices start rising steadily, with more participants entering the market as optimism spreads.
- Euphoria: A critical tipping point where asset prices become detached from fundamentals, and speculative frenzy dominates. Investors ignore warning signs, convinced that prices will never fall.
- Collapse: The inevitable breaking point, where reality catches up, confidence evaporates, and the market experiences a sharp downturn as investors rush to exit.
Understanding these stages provides a roadmap for identifying early warning signs in current markets. Whether it’s the housing market, stocks, or cryptocurrencies, the history tend to repeat itself.
Speculative Bubbles and Irrational Behavior
Speculative bubbles have an almost hypnotic effect on markets, luring in investors with the promise of ever-rising prices. Unlike rational investing, where asset prices are anchored to intrinsic value, bubbles thrive on expectations—people buy not because they believe in an asset’s long-term worth, but because they assume someone else will pay even more for it tomorrow. This cycle, driven by collective optimism, creates a self-reinforcing loop where price appreciation fuels even greater speculation. Eventually, however, reality sets in. The disconnect between price and value becomes unsustainable, and the rapid crash wipes out wealth as quickly as it was created.
History is littered with examples of speculative frenzies, from the Dutch Tulip Mania to the dot-com boom and, more recently, the cryptocurrency bull runs. Each follows a familiar pattern: excitement, rapid price acceleration, euphoric buying, and a sudden collapse. But what fuels this irrational behavior? Nobel laureate Robert Shiller (2003) coined the term “irrational exuberance” to describe the psychological forces that drive investors to push prices far beyond fundamental justification. Emotions like fear of missing out (FOMO), overconfidence, and greed override rational analysis, leading to speculative excesses that inflate bubbles.
In theory, financial markets should be governed by logic, with investors making data-driven decisions. However, real-world markets tell a different story—one shaped as much by emotion and perception as by economic fundamentals. Behavioral finance research has shown that cognitive biases distort decision-making in ways that traditional economic models fail to capture.
Social contagion plays a critical role in the escalation of bubbles. When a wave of optimism spreads across financial media, social networks, and trading communities, the pressure to participate intensifies. Investors fear being left behind and rush in, further inflating prices. Ironically, this same psychological force accelerates the collapse—as soon as the first signs of trouble emerge, the herd rushes for the exits, triggering a downward spiral.
Ultimately, speculative bubbles remind us that markets are not purely mechanical systems driven by data and models—they are deeply human, shaped by emotion, perception, and collective behavior.
Detecting Asset Price Bubbles Using Martingales
Building on the understanding of speculative behavior and the psychological factors driving market dynamics, we can turn to a more mathematical and technical approach for detecting asset price bubbles. One such method is the examination of whether an asset price process follows a strict local martingale, a concept grounded in stochastic processes.
In simple terms, a martingale is a stochastic process where the expected future price, given all current information, is equal to the present price, indicating no arbitrage opportunities. This reflects the notion of a fair game, where the price is equally likely to go up or down. However, a strict local martingale introduces the possibility of temporary deviations from this equilibrium, making it an invaluable tool for identifying potential bubbles. These deviations from the fair game behavior suggest that prices are moving away from their intrinsic value, which is a hallmark of speculative bubbles.
To detect such bubbles using this approach, one would analyze the return time series of an asset and assess whether it exhibits the characteristics of a strict local martingale. In practice, this means looking for periods when the asset price behaves like a random walk—where future price movements are unpredictable and medium-term return expectations show signs of decline. A critical challenge in this method is accounting for the volatility of asset prices, which can fluctuate over time and complicate the analysis. During periods of high volatility, it may become more difficult to discern whether the price deviations are driven by speculative behavior or by legitimate changes in market conditions.
Mathematical Solution of Martingales and Use of ADF Test
In the realm of asset price bubbles, a martingale process offers a fascinating mathematical framework. In simple terms, a martingale suggests that the expected future price of an asset, based on all available information up to a certain point in time, should equal the current price. This concept is foundational for understanding whether an asset's price is driven by fundamentals or speculative forces. Mathematically, the martingale condition is expressed as:
E[Pt+1 | Ft] = Pt
Here, Pt represents the asset price at time t, and Ft denotes the information set available up to time t. When an asset price behaves as a martingale, it implies that prices follow a random walk, meaning there are no predictable trends or drifts in price, and no opportunities for riskless profits. This is the expected, "fair game" behavior in financial markets.
However, when speculative bubbles take hold, prices begin to deviate from this martingale behavior. Rather than reflecting underlying fundamentals, prices become driven by excessive speculation, creating a disconnect that can persist over time. This deviation can be modeled quantitatively using a log-linear model to represent the gap between the observed price and the fundamental value:
log(Pt) = log(Fundamental Value) + ϵt
In this equation, log(Pt) is the logarithm of the observed price, while log(Fundamental Value) represents the true value of the asset, and ϵt captures the noise in the market—both random fluctuations and the influence of speculative behavior.
Augmented Dickey-Fuller (ADF) Test
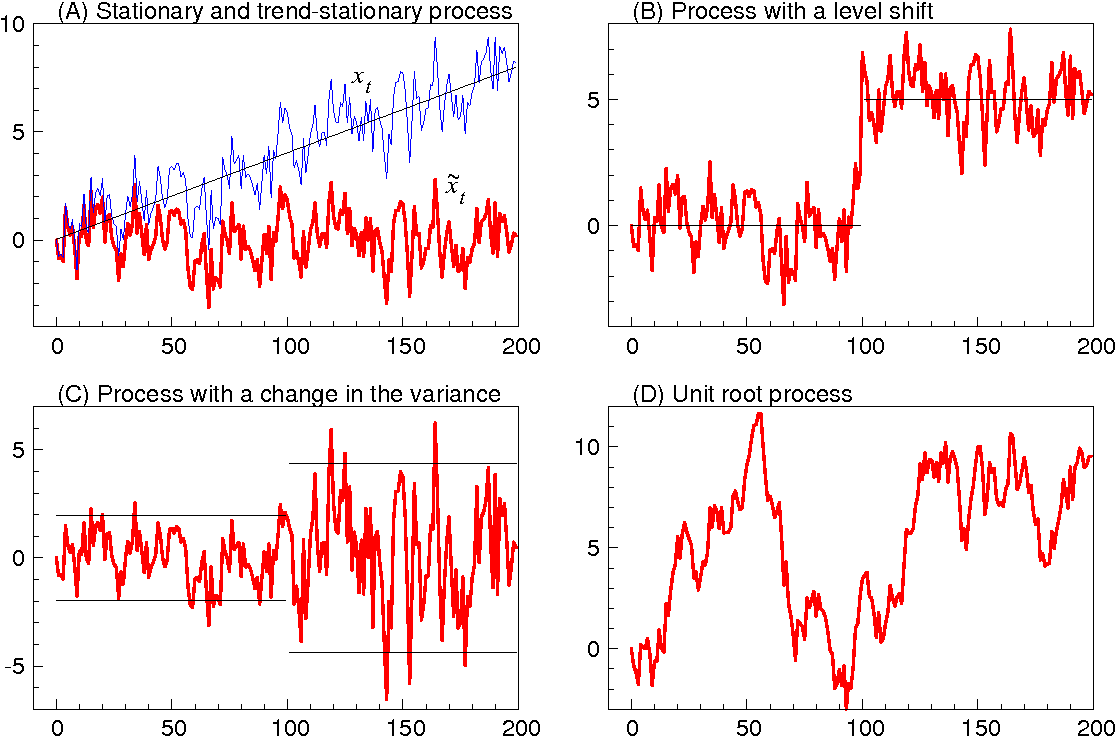
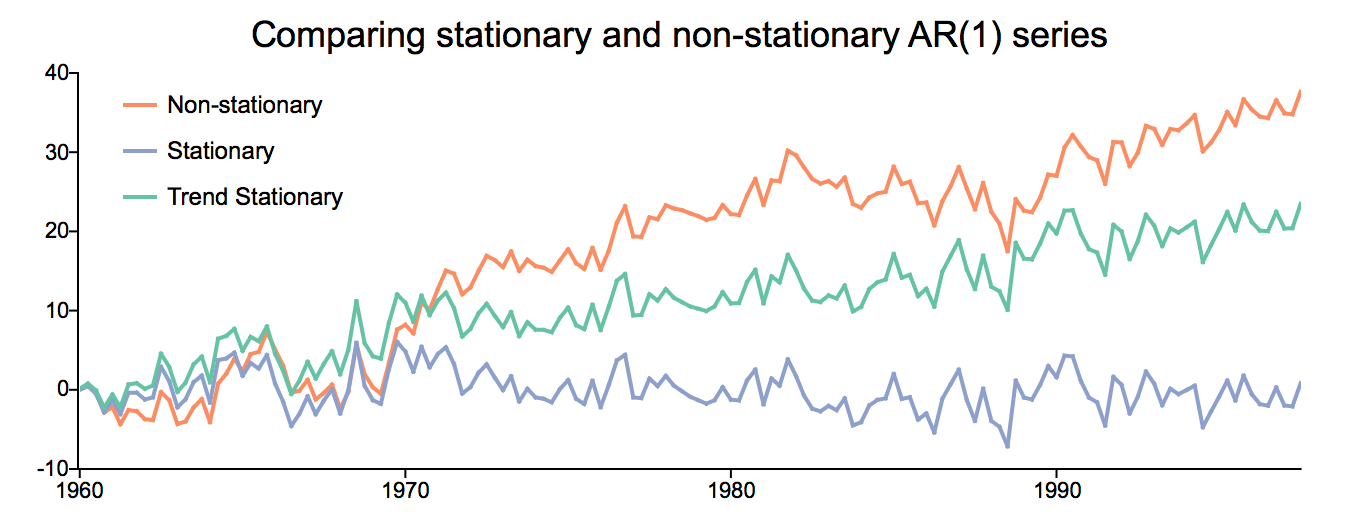
A valuable tool for analyzing this deviation and identifying potential bubbles is the Augmented Dickey-Fuller (ADF) test. The ADF test is widely used to detect the presence of a unit root in a time series, which can indicate whether the series is non-stationary—an important sign of a speculative bubble. In essence, a non-stationary time series shows that the asset price doesn't mean-revert to a fundamental value, but rather drifts away over time.
Hypotheses of the ADF Test
- Null hypothesis: The time series has a unit root, meaning the asset price is non-stationary (potential bubble).
- Alternative hypothesis: The time series is stationary, suggesting that the price will eventually revert to its fundamental value.
The test is performed using an autoregressive model, where the first difference of the log price is regressed on lagged values:
Δlog(Pt) = α + βlog(Pt-1) + ∑i=1k γi Δlog(Pt-i) + ϵt
Here, Δlog(Pt) represents the change in the logarithm of the asset price, and k is the number of lags in the regression. If the test statistic falls below the critical value, the null hypothesis of non-stationarity is rejected, indicating that the asset's price series is mean-reverting.
Time Windows for Detecting Speculative Bubbles
To assess whether an asset is experiencing speculative bubbles, we can apply the ADF test over different time windows—short-term (e.g., 1-month) and long-term (e.g., 1-year). By analyzing these time frames, we can observe how market sentiment evolves and whether the asset price’s deviation from its fundamental value is temporary or sustained.
Short-Term Window (1 Month)
The ADF test may capture immediate speculative fluctuations that temporarily drive the price away from its fundamental value. If the test fails to reject the null hypothesis of non-stationarity during a short-term period, it may signal early signs of a speculative bubble.
Long-Term Window (1 Year)
Over a longer period, if the price series remains non-stationary, it suggests that speculative forces are sustaining the price above its fundamental value, possibly indicating a more developed bubble.
By comparing the results of the ADF test across these time windows, we can gain a deeper understanding of the duration and intensity of speculative behavior. If the ADF test consistently fails to reject the null hypothesis of non-stationarity over both short and long-term windows, this may indicate that the asset is experiencing a prolonged speculative bubble, where prices continue to deviate from their fundamental value.
Bitcoin Experiment Application
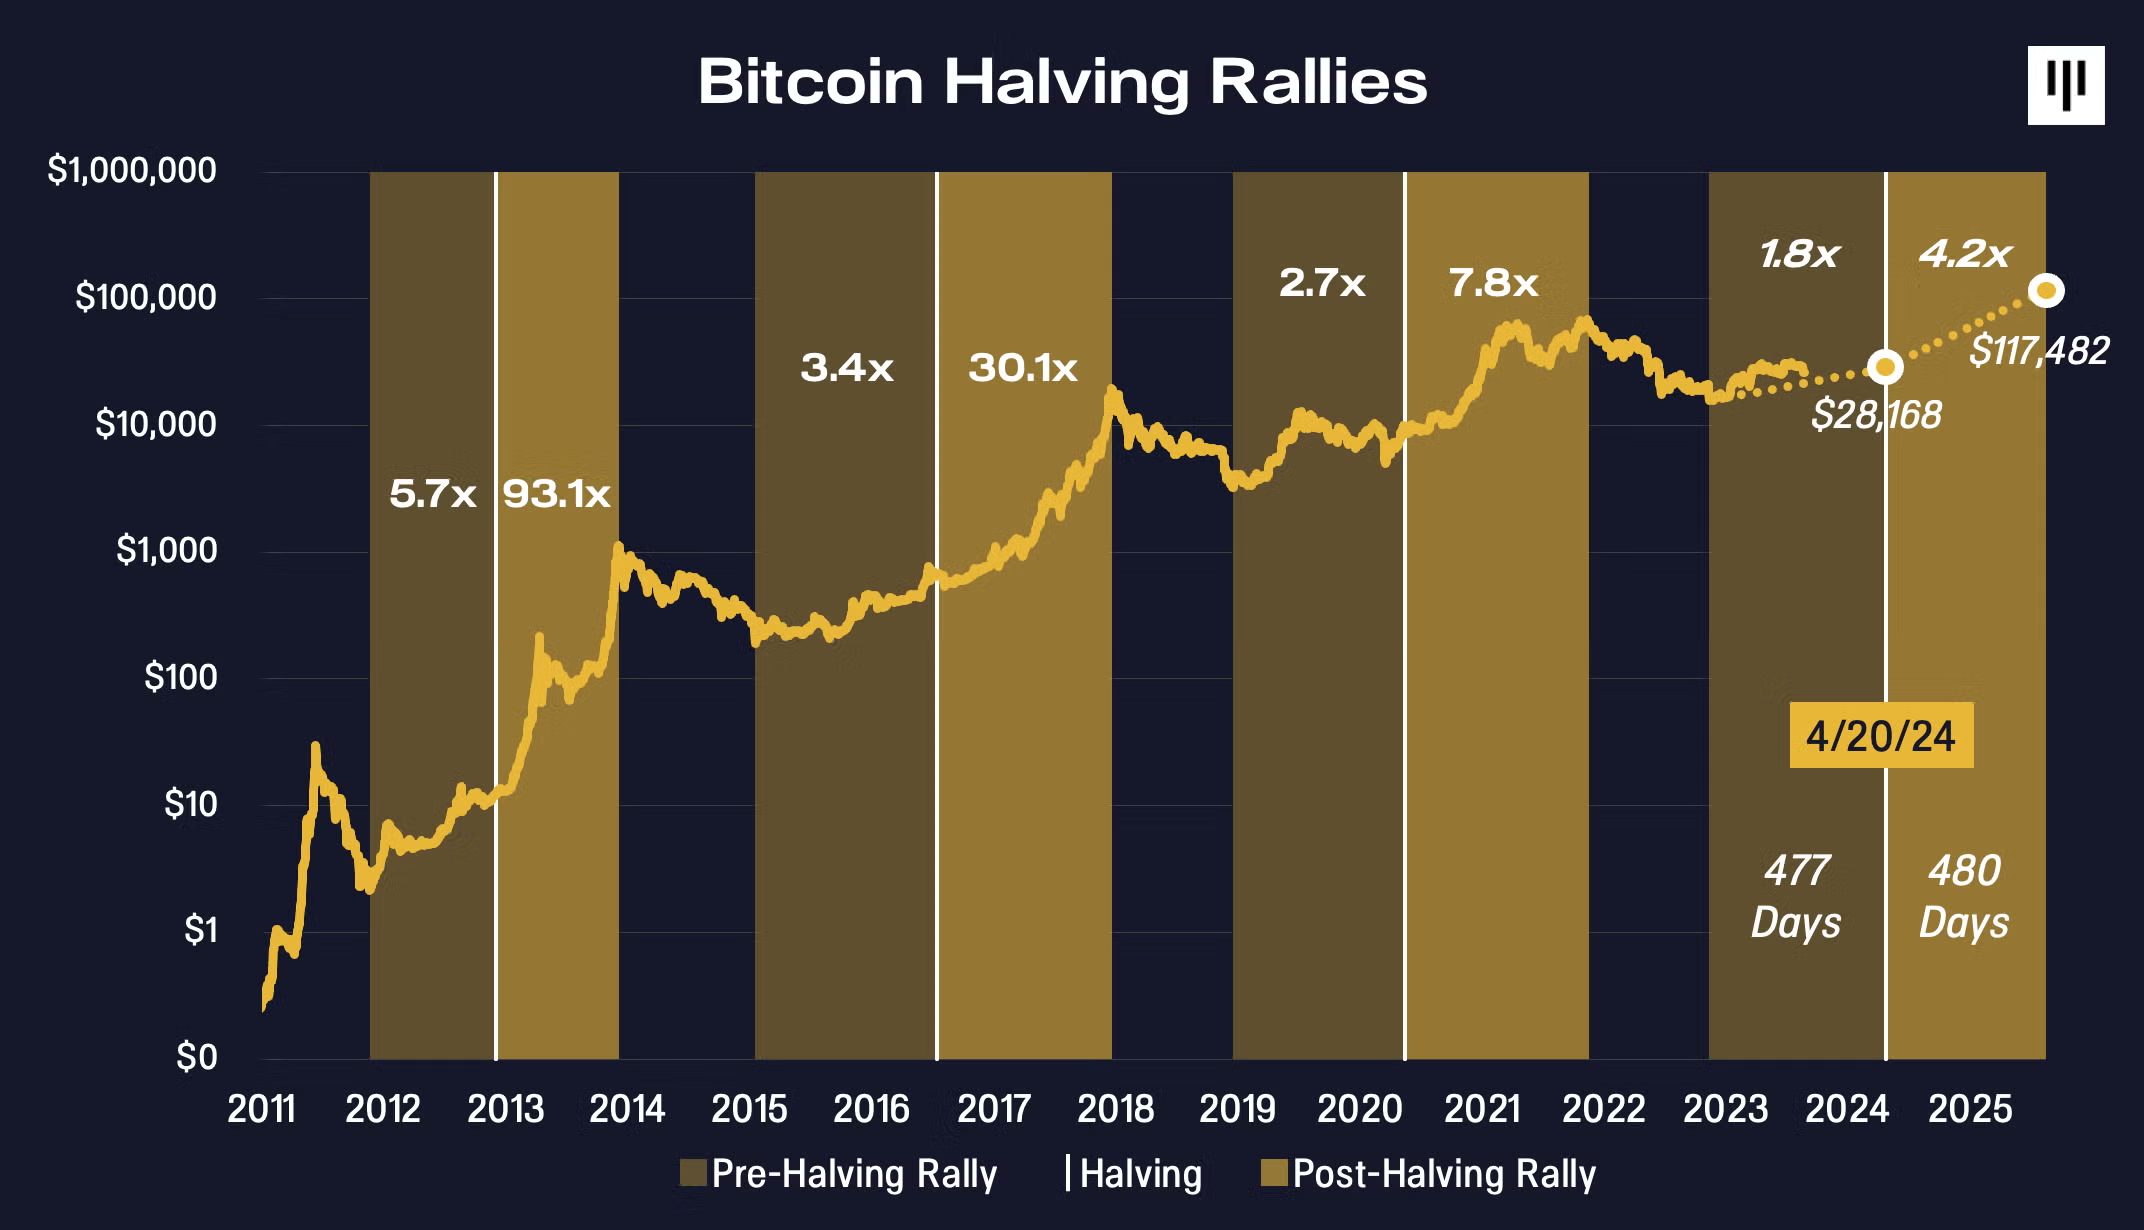
Let us consider the application of the ADF test to Bitcoin price data from January 2020 to January 2025, using both short-term (1-month) and long-term (1-year) windows.
During periods of rapid price appreciation, such as mid-2020 to early 2021, the ADF test unequivocally rejects stationarity, signaling non-stationarity and confirming bubble-like behavior. This period was driven by speculative forces rather than Bitcoin’s fundamental value, which suggests that the price was inflated by short-term exuberance, not supported by the underlying asset fundamentals.
In contrast, during more stable periods, such as mid-2021 to late 2022, the ADF test confirms stationarity, indicating that Bitcoin’s price movements were more in line with long-term valuation. This suggests that Bitcoin’s price was not distorted by speculation but was reflective of its adoption and increasing recognition as a store of value over time. It aligns with the growing institutional interest and long-term adoption of Bitcoin as a legitimate financial asset.
This analysis observation illustrates how speculative forces can cause significant price distortions in the short term. When non-stationarity is observed across both short and long-term windows, it signals that speculative behavior is persistent, potentially leading to a market correction or collapse. Conversely, if stationarity is observed in longer time frames, it indicates that the market is correcting and aligning more closely with the asset’s fundamental value, which is essential for Bitcoin’s broader adoption as a stable financial instrument.
The results of this analysis are critical to monitor Bitcoin’s market dynamics in real time. By identifying when speculative bubbles are forming, they can make more informed decisions about market entry, risk management, and the potential for long-term asset stability. These insights are particularly valuable as Bitcoin transitions from being a speculative asset to a more widely adopted and recognized component of the global financial system.
Machine Learning for Bubble Detection
While traditional methods such as martingales provide a strong theoretical foundation for detecting asset price bubbles, they fall short when it comes to capturing the complex, non-linear dynamics of modern financial markets. These methods often struggle with the intricate patterns and evolving market conditions that underlie bubble formation. To address this gap, advanced machine learning techniques—particularly Recurrent Neural Networks (RNNs) and Long Short-Term Memory (LSTM) networks—offer powerful, dynamic tools that can better model the temporal dependencies inherent in financial time series data.
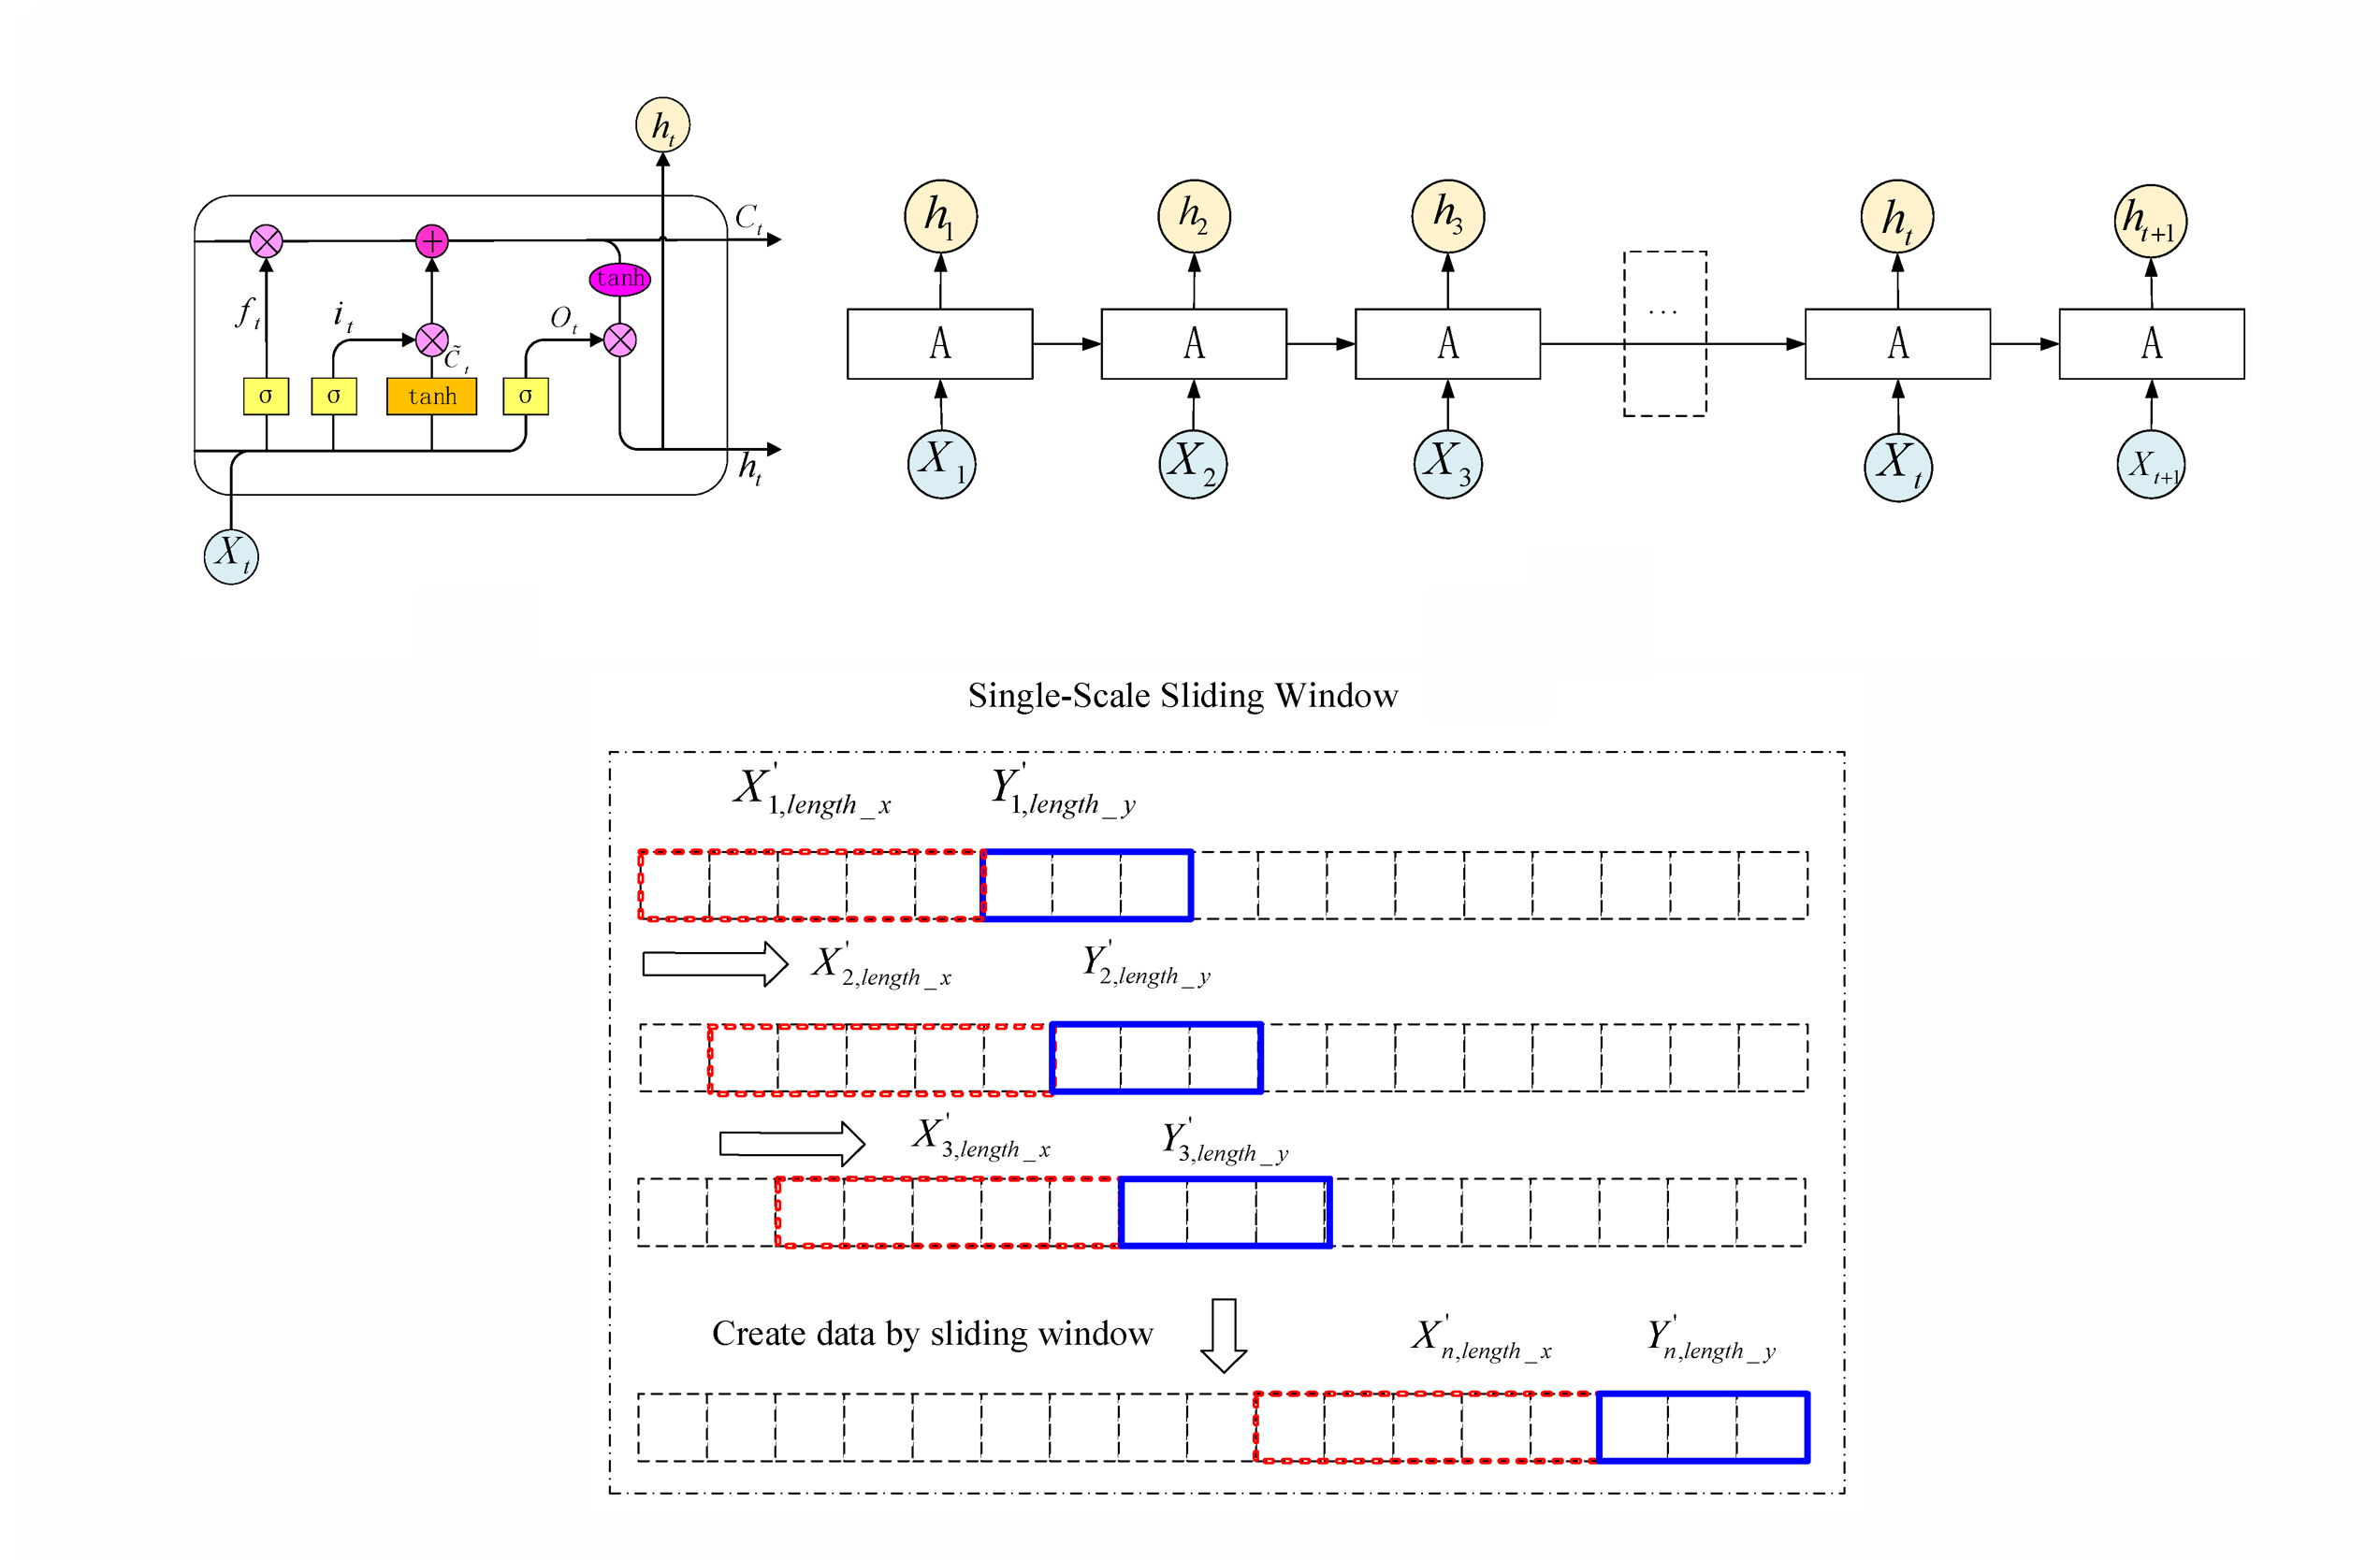
Recurrent Neural Networks and LSTMs
RNNs are designed specifically for sequential data, making them well-suited for analyzing asset price movements over time. Unlike traditional neural networks, RNNs can "remember" past information, which is crucial for financial markets where historical price movements influence future behavior. This ability to capture sequential dependencies is essential in identifying potential bubbles, where market momentum and investor sentiment drive prices far beyond fundamental values.
However, RNNs face a significant limitation known as the "vanishing gradient problem," which can make them less effective at capturing long-term dependencies in data. To overcome this, LSTM networks were introduced. LSTMs are an enhanced version of RNNs, designed with special memory "gates" that allow the network to retain information over longer periods. These gates help the network learn from long-term patterns in asset price movements, which are often the precursor to bubble-like behavior. LSTMs excel in environments where price movements exhibit sudden and non-linear shifts—typical characteristics of speculative bubbles.
For example, LSTM networks can be trained on historical data to identify patterns in price trajectories, such as the rapid acceleration of asset prices during the "Boom" and "Euphoria" phases of a bubble. Unlike martingales, which primarily detect deviations from a theoretical fair price, LSTMs are capable of recognizing subtle shifts in market behavior over time, including investor-driven price surges that are characteristic of a bubble. LSTMs adapt to these complexities by modeling intricate time-dependent patterns. This adaptability allows them to not only detect the onset of speculative behavior but also to track its evolution, offering real-time insights into the likelihood of a bubble.
Real-Life Application to Asset Pricing
When applied to asset price data like Bitcoin, the LSTM can learn from historical price trends and volatility, identifying periods where price movements are driven by speculative behavior. For example, during 2020-2021, when Bitcoin saw rapid appreciation, the LSTM might identify this surge as part of a "Boom" phase of a bubble. The model would detect these irregular price movements by recognizing non-linear patterns, such as:
Pt = α ⋅ Pt−1 + β ⋅ ΔVt + γ ⋅ St + ϵt
Where:
- Pt is the asset price at time t (e.g., Bitcoin’s price).
- ΔVt is the change in trading volume.
- St represents sentiment indicators (e.g., positive/negative news or social media sentiment).
- α, β, γ are coefficients that reflect the influence of past price movements, volume, and sentiment on current prices.
- ϵt is the error term.
By training on historical data, the LSTM learns how changes in trading volume, sentiment, and price momentum contribute to speculative price surges. When these factors align—such as rapid increases in trading volume and overly positive sentiment during a price spike—this combination often signals the onset of a bubble.
Advantages of Neural Networks for Bubble Detection
Simulations and empirical studies have shown that LSTM networks outperform conventional models in detecting asset price bubbles. While traditional volatility models often fail to predict bubbles in advance—or flag price fluctuations as bubbles prematurely—LSTMs leverage historical data to identify early warning signs of unsustainable price surges. This leads to more accurate and timely bubble predictions, enabling market participants to take preemptive action before a bubble bursts.
The primary strength of LSTMs lies in their ability to handle high-dimensional, noisy, and volatile data, characteristic of asset price movements. In financial markets, asset prices are influenced by numerous factors—economic events, investor sentiment, and sudden shifts in liquidity—which makes traditional models prone to over-simplification. LSTM networks circumvent this by learning directly from the data, allowing them to capture both linear and non-linear relationships without relying on rigid, pre-specified assumptions about market behavior.
Moreover, LSTM networks are not limited to modeling price data alone; they can incorporate other market signals, such as trading volume, sentiment analysis, and volatility shifts, which provide a more comprehensive view of market conditions. This "data-driven" approach equips LSTMs to detect bubbles with higher precision, as they can identify complex interactions between multiple market factors that contribute to price distortions.
In practice, LSTM-based models can be integrated into real-time monitoring systems for financial markets, providing continuous analysis of asset price data. These systems can alert investors and analysts when the likelihood of a bubble forming increases, enabling proactive decision-making.
Conclusion
Bubbles aren't just anomalies in the market—they are reflections of human behavior, where perception twists and distorts reality. In these turbulent periods, whether during euphoric price surges or devastating crashes, market participants often act on exaggerated optimism or irrational fear, leading to imbalances between asset prices and their true fundamental value. While traditional models like martingales offer theoretical insight into these deviations, they fall short when faced with the complexity and rapid evolution of modern financial markets.
Here is where machine learning, particularly LSTM networks, make all the difference. With their ability to adapt and learn from vast, time-sensitive data, they can detect the intricate patterns of market psychology that precede bubbles—patterns that traditional models simply can't capture. LSTMs don’t just analyze price fluctuations; they understand the dynamics of market sentiment, trading volume, and volatility, allowing them to recognize emerging risks long before the bubble bursts.
The future of bubble detection doesn’t lie in choosing between traditional models and machine learning; it lies in their powerful integration. Combining the theoretical rigor of models like martingales with the data-driven, adaptive capabilities of neural networks, we gain a far more accurate, dynamic, and timely understanding of financial bubbles. This convergence offers investors and policymakers a critical advantage—providing the foresight to detect emerging bubbles and act swiftly to protect value. As volatility grows, advancing detection methods is essential. By combining traditional models with machine learning, we can make smarter, faster decisions—staying ahead of risks and protecting value in an unpredictable market.